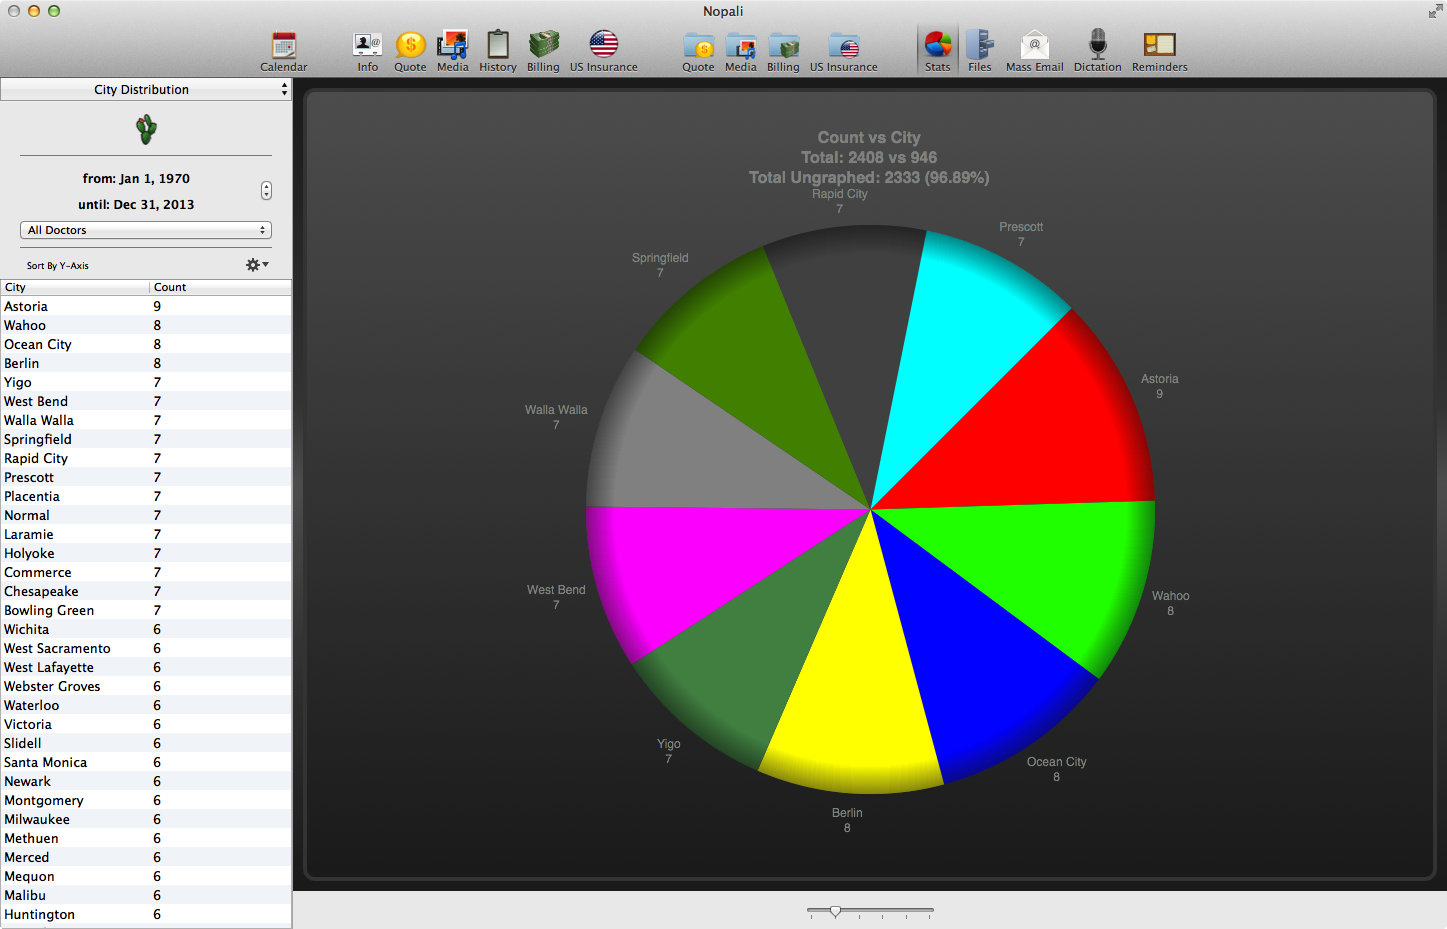
With Nopali, you can view a statistical breakdown of office data. Press the Office Statistics toolbar item to see this view:


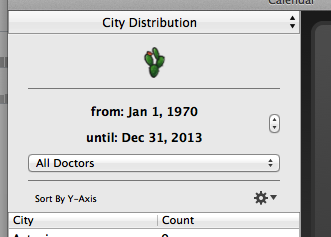
The Office Statistics view will present to you both a numeric and graphical representation of office data based on the search criteria set in the left margin. You can determine which analysis you want to see by selecting from the pop up button at the top of this area. Date range and specific doctors can also be set:

The main window show the graphical result. You can increase the number of 'slices' but using the slider near the bottom of the view:
