Nopali provides a statistical breakdown of office data, presented in both numerical and graphical formats. To access this feature, click the Office Statistics toolbar item:
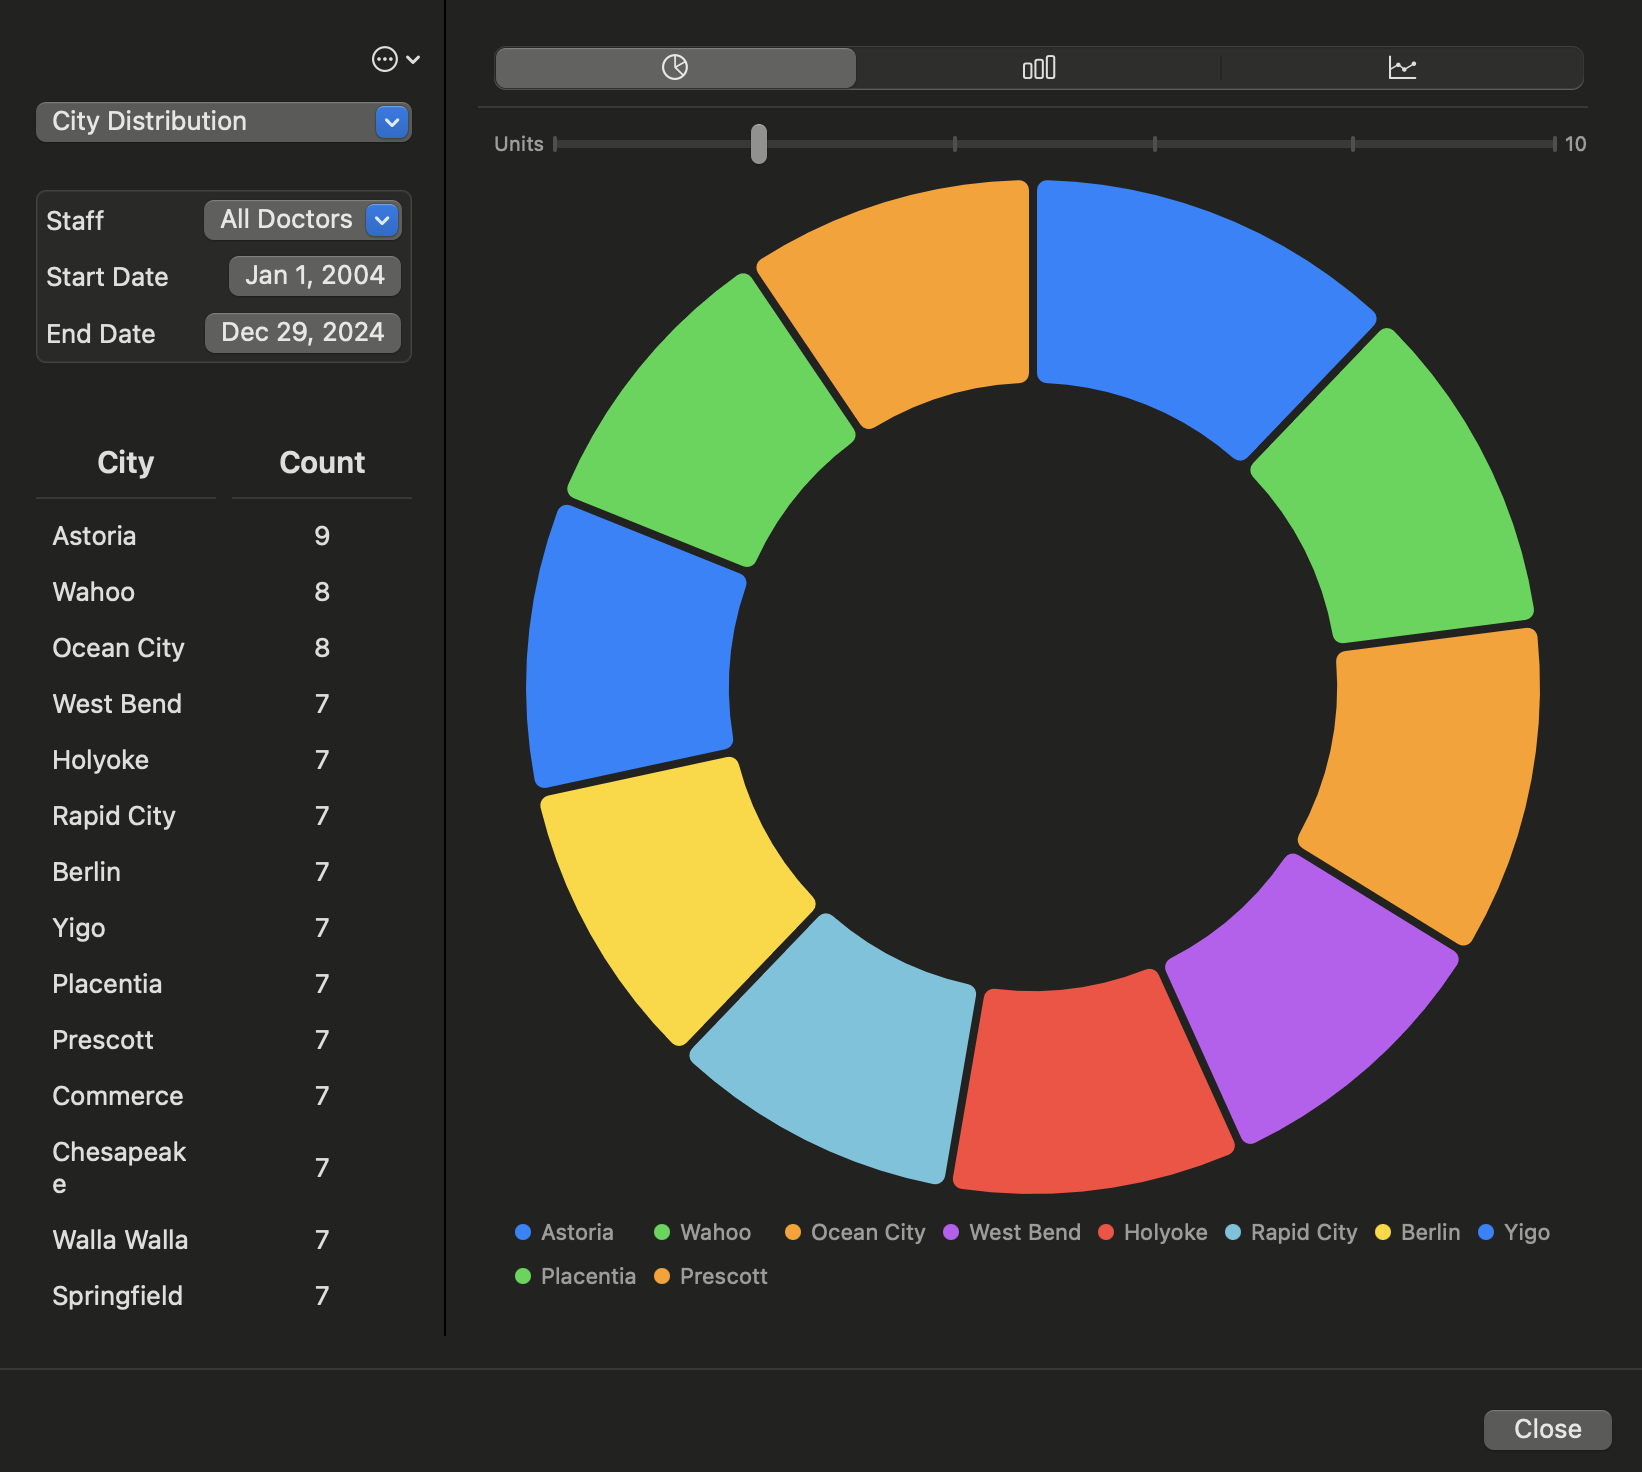
The statistics interface displays a variety of data analyses based on the selected search criteria.
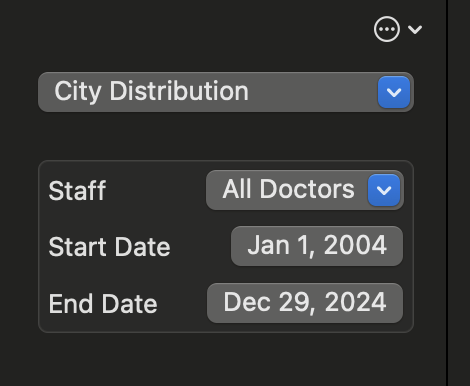
You can refine the analysis using the search options located in the left panel. Select the type of statistics you want to view from the dropdown menu, and adjust filters such as date range and specific doctors:
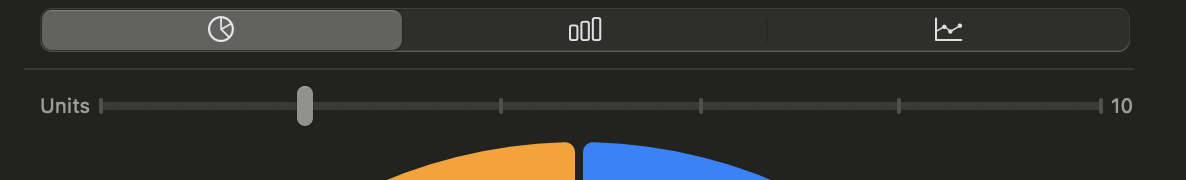
The main window displays graphical representations of the selected statistical data. You can increase the number of data segments using the Units Slider: